Scientists told us our winters would get drier. So what happened last week?
Climate change means extreme events are likely to happen more often
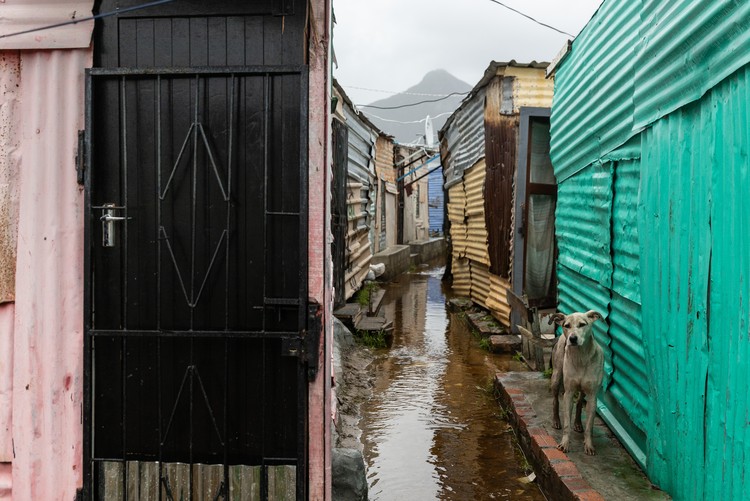
Masiphumelele in Cape Town was flooded last week. Photo: Ashraf Hendricks
Climate projections have been suggesting warmer and drier winters for the south-western Cape. So why did we get such heavy rain and flooding last week? There are several reasons.
Rising sea surface temperatures and increased moisture in the atmosphere, as a result of climate change, could contribute to the formation of more cut-off low pressure systems such as the one which caused so much destruction last year. But the main rain-bearing systems affecting the south-western Cape are mid-latitude cyclones (not the same as tropical cyclones) where cold fronts undercut warmer air and, assisted by the mountain terrain, cause significant rainfall, usually in winter.
These systems develop over the Atlantic Ocean to the west and are caused by a polar wave moving from west to east. This wave marks the boundary of a mass of cool air (to the south) and warmer air (to the north). As the wave intensifies, it draws the cold air into a clockwise vortex, with warm and cold fronts. The warm fronts pass to the south of the continent, but the cold fronts bring cold and wet conditions.
The frequency of these fronts is highly variable from year to year. Their absence is what causes drought, as happened in 2015-7, when the lack of rain caused critical water shortages.
When these extreme events occur and impact on people’s livelihoods, infrastructure and the economy as a whole, we need to look at the likelihood of any permanent changes to the weather and climate in the region. Will there be a “new normal” and if so what will it look like?
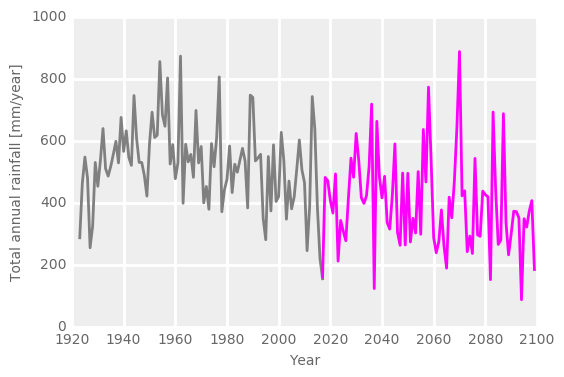
Piotr Wolski from UCT’s Climate System Analysis Group has suggested that rainfall variability should be seen in the context of climate change. The graph below (made in 2017) is a hypothetical future scenario for Cape Town, and shows a variable rainfall pattern, but also an underlying drier trend. Within the variability, one can see very dry years, such as 2022 and 2038, with rainfall around 200mm a year, and also wet years such as 2037 and 2059, with rainfall around 800mm a year. Cape Town’s average rainfall is about 580mm (measured at Cape Town International Airport). So, this suggests we can expect a smaller number of years with high rainfall, with most years centred around a lower average of about 400mm.
But, this month we have seen rainfall, in one week, equivalent to about a third of annual rainfall. So what does this mean for the predictions?
This is where it gets complicated. The amount of rainfall in a frontal system depends on many factors, such as the pressure gradient, which determines the wind and the amount of moist air lifted up into the front’s cloud banks; the sea temperature; how close the front is to the coastline; the impact of the mountains in its path; and the latitude of the front.
Theoretically, climate change can affect all this in two main ways. The natural variation may change if the westerly winds, are pushed further south and force the cold frontal systems to pass too far south to bring significant rain over the land. This is unlikely to occur all at once, without a large-scale event which shifts the global climate, such as the collapse of the Greenland or Antarctic ice sheets. More likely, we will see this process taking several decades. So, in the coming years we will still see year-to-year variability in rainfall, with an overall drier trend.

Graph by Piotr Wolski (created in 2017). The black line is actual data. The pink link is projected forward.
The second way global warming may affect these cold fronts is by speeding up the melting of Antarctic ice. The impacts of this are complicated, but one would be the effect of rising sea levels on storm surges, where frontal rain and tidal surges cause flooding which extends inland from the coast. Another effect would be that of melted ice water flowing into a (slightly) warmer ocean, forming cooler pools of water that, in turn, cause the air above them to be cooler. Some of these pools can feed into the polar wave and bring chillier conditions when these fronts make landfall. These tongues of cool air are more common in higher latitudes, and are often felt in the continental USA, bringing freezing conditions right across the country.
Ultimately, though, it is well-nigh impossible, and most unwise, to blame a specific event such as last week’s rain entirely on human-induced global warming.
However, it is likely that global warming is leading to a global climate change, mostly evidenced by increased temperatures (of land and sea), more heatwaves, more intense rainfall and a change in the frequency of atmosphere/ocean phenomena like El Niño. Extreme events, such as intense rainfall and even droughts are more likely to occur in a warmer future.
In South Africa as a whole, there have been measurable impacts of climate change and these have, in turn, had consequences for various sectors, such as agriculture, water and health. Temperature increases are more obvious with significant increases (up to 1 degree C) recorded in most regions over the last 50 years. Other effects include more frequent droughts, heat stress on farmworkers and livestock, especially dairy cattle, increased frequency of heavy rainfall, and increased risk of fire damage to crops and natural vegetation.
The future pace of climate change depends on the ability of the world to reduce global greenhouse gas emissions. South Africa’s economic trajectory will depend on the swift transition from coal to solar and wind energy to ensure affordable and reliable electricity.
South Africa has led calls for a “just transition” in international climate negotiations – a process of putting people and livelihoods at the centre of climate responses. Given the contribution of the agricultural and conservation sectors to employment creation in South Africa, climate responses in these sectors form an important part of the country’s just transition.
Combating the impacts of climate change requires both adaptive measures (such as adaptive farming practices) and commitment - local and international - to reduce emissions.
Support independent journalism
Donate using Payfast

Don't miss out on the latest news
We respect your privacy, and promise we won't spam you.
© 2024 GroundUp. This article is licensed under a Creative Commons Attribution-NoDerivatives 4.0 International License.
You may republish this article, so long as you credit the authors and GroundUp, and do not change the text. Please include a link back to the original article.
We put an invisible pixel in the article so that we can count traffic to republishers. All analytics tools are solely on our servers. We do not give our logs to any third party. Logs are deleted after two weeks. We do not use any IP address identifying information except to count regional traffic. We are solely interested in counting hits, not tracking users. If you republish, please do not delete the invisible pixel.

