GROUNDVIEW: For the first time most adults didn’t vote
There has been a decline in election participation since 1994, especially this year

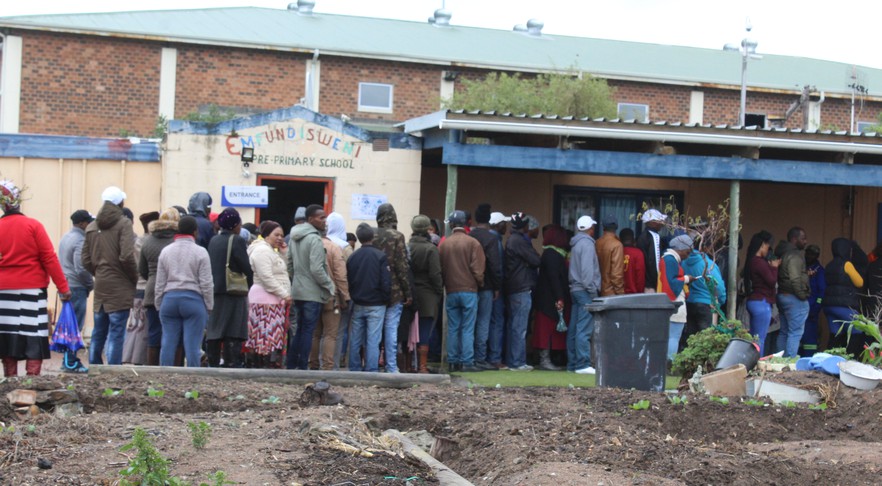
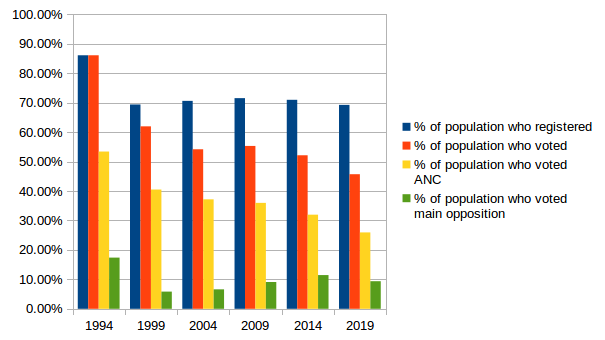
For the first time in democratic South Africa, less than half the adult population went to the polls. And the ANC was elected by only slightly more than one in four adults.
In 1994, 86% of adults voted. More than half of people eligible to vote elected the ANC. Since then, except for 2009, there has been a steady decline in the percentage of people participating in elections. It would be unrealistic to expect the euphoria of 1994 to be matched, but the decline in voter participation is alarming.
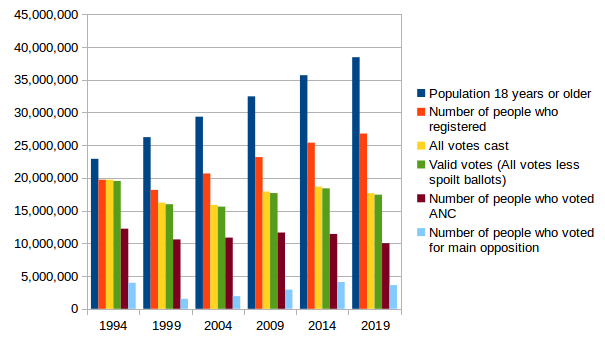
The ANC got fewer votes in 2019 than ever before despite the population being nearly 1.7 times bigger than in 1994.
But the picture isn’t rosy for the biggest opposition party either. In the first democratic election, the National Party got more votes than the DA did this year.
The tables below show this decline.
| Year | 1994 | 1999 | 2004 | 2009 | 2014 | 2019 |
| Population > 18 | 22.9m | 26.2m | 29.3m | 32.4m | 35.8m | 38.7m |
| Population registered | 19,726,610 | 18,172,751 | 20,674,923 | 23,181,997 | 25,388,082 | 26,779,025 |
| All votes | 19,726,610 | 16,228,462 | 15,863,558 | 17,919,966 | 18,654,771 | 17,671,616 |
| Valid votes (All votes less spoilt ballots) | 19,533,498 | 15,977,142 | 15,612,671 | 17,680,729 | 18,402,497 | 17,436,144 |
| Votes for ANC | 12,237,655 | 10,601,330 | 10,880,915 | 11,650,748 | 11,436,921 | 10,026,475 |
| Votes for main opposition (NP in 94, DP in 99, DA since) | 3,983,690 | 1,527,337 | 1,931,201 | 2,945,829 | 4,091,584 | 3,621,188 |
The voting data is from the IEC (with spoilt ballots for 1994 from Wikipedia). Estimates of the population over the age of 18 are derived from the Thembisa AIDS model, and have been rounded to the nearest 100,000 to avoid false accuracy. Sources other than this may be used perhaps, but would be unlikely to change the general picture. Voters did not need to register in 1994, so registered voters and number of voters in that year are set equal.
| Year | 1994 | 1999 | 2004 | 2009 | 2014 | 2019 |
| % of population who registered | 86 | 69 | 71 | 72 | 71 | 69 |
| % of population who voted (including spoilt) | 86 | 62 | 54 | 55 | 52 | 46 |
| % of population who voted ANC | 53 | 40 | 37 | 36 | 32 | 26 |
| % of population who voted main opposition | 17 | 6 | 7 | 9 | 11 | 9 |
Here are graphs of these tables:


Apathy vs anger?
So why is voter participation dropping? Is it apathy?
It’s likely that a large number of people don’t vote simply because they have little interest in politics. But this is probably not the whole story.
In the run-up to the elections GroundUp heard the same message repeated by protesters angry at what they see as government failures. They did not threaten to vote for opposition parties rather than the ruling party. Instead they threatened not to vote. Of course what people say in the heat of a protest, and what they end up doing are not always the same, but this does suggest that anger is a big factor in declining turnout as well. And often it can be a combination of anger and apathy in the same person.
The inevitable disappointment of ruling parties — and we use the plural because not only the ANC rules at provincial and local level — failing to fulfill their promises plus the massive corruption of the Zuma administration has probably contributed to low participation. Also, let’s not forget how the arms deal under Mbeki, as well as his AIDS denialism, soured the positive image of the ANC in the 2000s.
But all this is just speculation. Properly understanding declining participation is a task for researchers.
So what?
People who haven’t voted have chosen not to be counted, so they shouldn’t complain, some argue. This is true to some extent.
But declining voter participation does undermine the legitimacy of a democratic system, at least a little. Particularly worrying is that the number of young people participating has dropped dramatically. In April the Parliamentary Monitoring Group pointed out that the number of 18 and 19-year-olds who registered in 2019 was nearly half that of 2014.
Lower turnout also points to a loss of confidence in normal politics. That in turn can lead to more support for ethnically divisive parties. We’ve seen that in this election: 3rd, 4th and 5th places went to the EFF, IFP and FF+, parties which, to put it politely, built their campaigns on race. Together they won nearly 17% of the valid vote.
Not since the National Party in 1994 — in very different circumstances — has race-based politics won such a large percentage of the vote.
We think that is deeply troubling.
Support independent journalism
Donate using Payfast

Don't miss out on the latest news
We respect your privacy, and promise we won't spam you.
Next: Gugulethu backyarders make community hall their home
Previous: Probe into fraud and corruption at National Lotteries Commission
© 2019 GroundUp.
This article is licensed under a Creative Commons Attribution-NoDerivatives 4.0 International License.
You may republish this article, so long as you credit the authors and GroundUp, and do not change the text. Please include a link back to the original article.
