
21 April 2021
Sister Zoliswa Gidi-Dyosi, a registered nurse and midwife, was the first recipient of the Covid-19 vaccine at the Khayelitsha Hospital in Cape Town, South Africa. Archive photo: Jeffrey Abrahams
Tough decisions appear to be everywhere in the Covid-19 pandemic era, especially in the area of regulation and policy, where imperfectly known benefits need to be traded against the costs of either supporting this or opposing that. Right now, the world is in a crucial stage of early monitoring of vaccine programmes. A number of national vaccination rollouts have been paused in recent weeks because of concerns about the risk of rare but sometimes fatal side effects.
The details of what challenges this presents to those in the unenviable position of having to make the key decisions are far too complex to be sensibly reviewed here. But there is an important insight that epidemiological modelling can show.
In short, hitting the pause button at an early stage of a vaccination programme can have larger-than-naively-expected consequences in the long run. It is probably better to continue vaccinating, while concerns are rapidly investigated. It is better to defer decisions to pause until, and only if, there is a specific course correction that has been decided.
If possible, epidemiological models should be adapted to local conditions to run pause scenarios in order to shed light on the downside of programme interruptions, before such interruptions are implemented.
We can show this without drowning ourselves in technical details. We developed some simple epidemic model scenarios which, while they cannot seriously “predict” the future in the real world, can realistically show key features of real-world interaction between transmission and population level immunity.
Our model world has these features:
All the details of how infectious the bug is, how fast the vaccine rollout is, when it starts, and whether and for how long it is paused, are tunable with inputs to the model. There are numerous details which we can’t explain fully here, but this document explains our model in more detail so that interested readers can test our results for themselves.
Idealised features such as, for example, that all people are equally good at spreading infection or that vaccination confers perfect immunity, do not really affect the findings of the model.
The basic output which this model generates is displayed below:
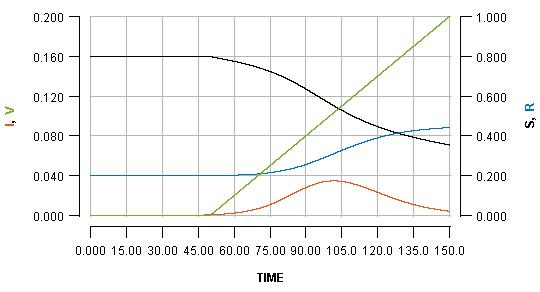
The horizontal axis shows the passing of time (nominally in days, but it does not matter). Various key quantities are indicated on either the left or right vertical axes.
S: the proportion of the population which is still susceptible to infection (right vertical axis)
I: the proportion of the population which is currently infected (left vertical axis)
R: the proportion of the population which has been infected but is already recovered (right vertical axis)
V: the proportion of the population which has been vaccinated (left vertical axis)
The most important curve, for the present argument, is the blue one, which indicates the cumulative cases of infection over time. The value which the blue curve reaches at the right side of the graph is the overall cost of the outbreak in terms of infections which the population has had to endure.
Note that the green line shows a steady rate of vaccination, with 20% (see the left vertical axis) of the population vaccinated at the end of the displayed scenario.
We can temporarily pause the vaccination programme whenever we want, for some period of time. Pausing it for two weeks, when the infection peak has almost passed, is shown as:
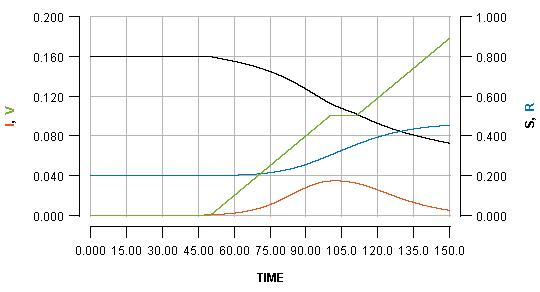
See how the pause reflects in the flat part of the green line, and how it impacts the blue line. Pausing vaccination for two weeks, just a few days after beginning it, is shown as:
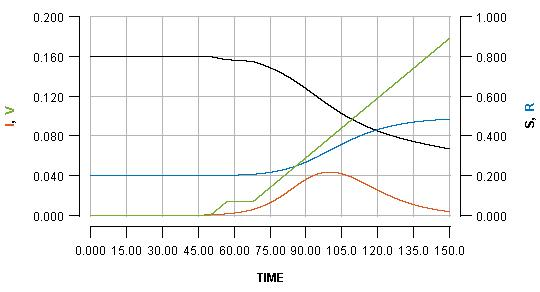
Note that the early pause is considerably more impactful than a late pause. In fact, the increase in cases produced by the early pause is greater than the number of people who missed their vaccination who become infected. It is even greater than the total number of people who would have been vaccinated during the pause.
It is very difficult to put real world numbers to this kind of dynamic, but the broad point is robust.
This is a consequence of the fact that vaccination not only protects the people who are vaccinated; it also protects everyone else because it limits transmission. By pausing early, one risks missing out on a significant boost in early immunity which can have a substantial impact on the unfolding of an imminent outbreak.
You may be able to see the effect more clearly if you see all three graphs as an animation. Note how in the early pause scenario the current infections line (red) has a considerably bigger bump, and the cumulative infections (blue line) endpoint is much higher.
So, again, in short: Hitting the pause button at an early stage of a vaccination programme can have larger-than-naively-expected consequences in the long run.