14 June 2021
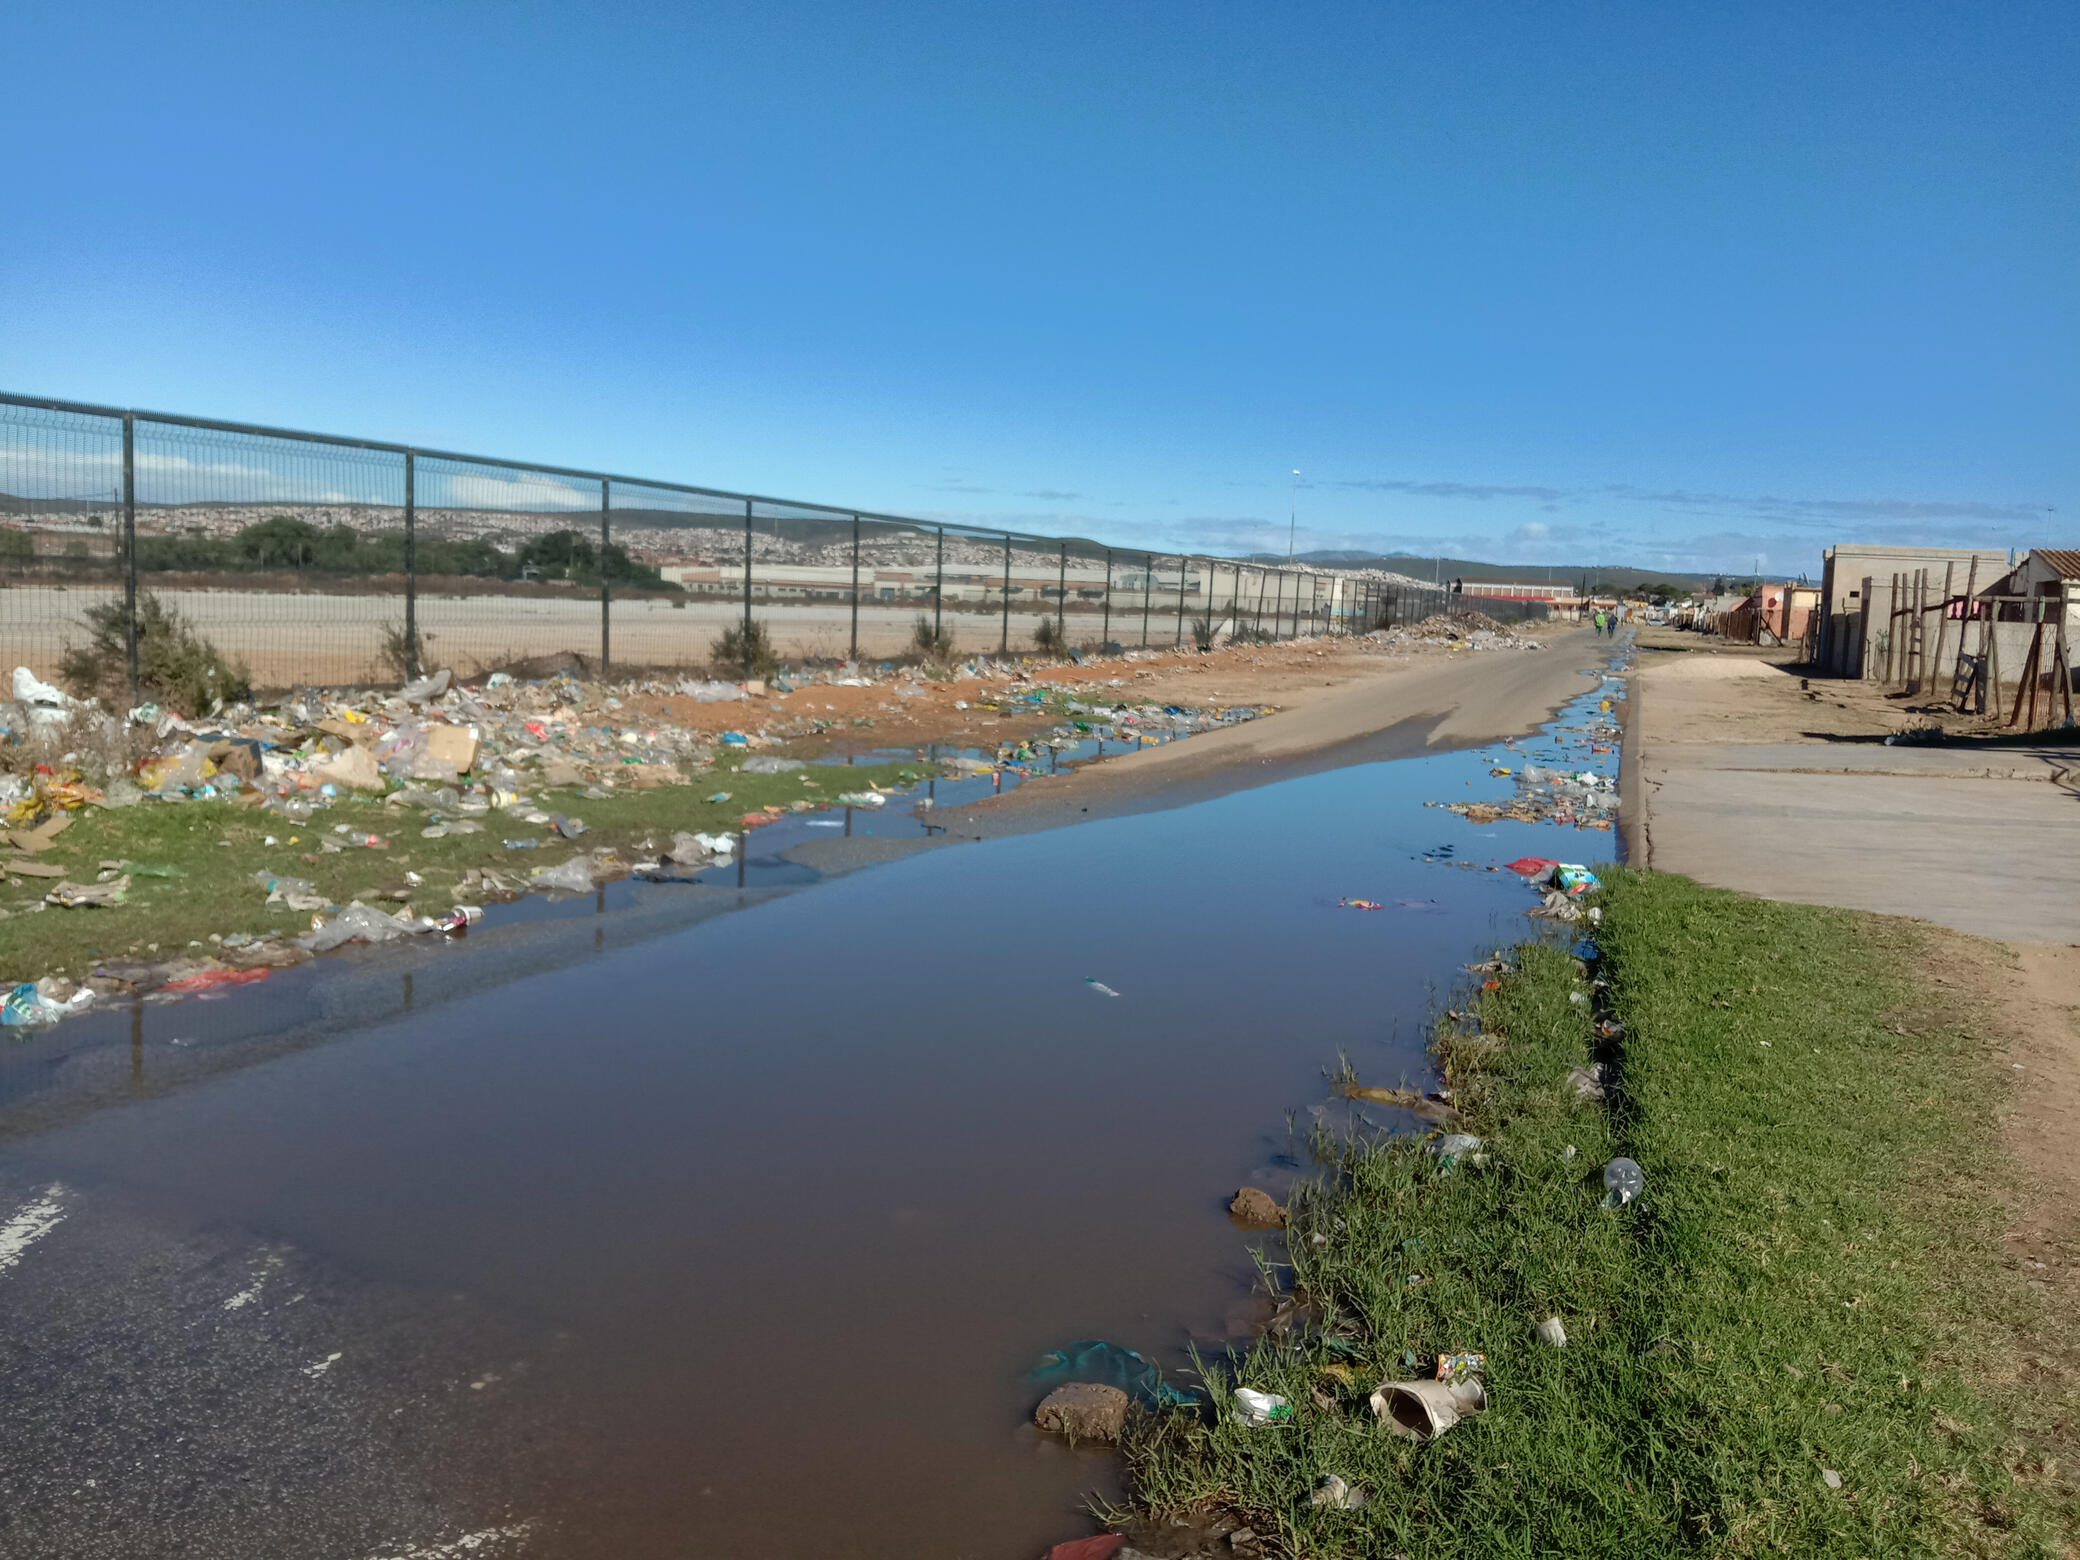
This street in Kariega, Eastern Cape is in an appalling condition. Municipalities have several important health functions, such as collecting refuse, fixing sewerage and providing clean water, but many are failing dismally. Archive photo: Thamsanqa Mbovane
This is the second of four short articles on health expenditure in the public and private sectors. This article considers the impact of local government on health. It is an edited, simplified version of this article published on both the GroundUp and Helen Suzman Foundation websites.
The Constitution gives four health functions to local government: air pollution, cleansing, municipal health services, and water supply and sewarage. As of 2019 there was official information available on how much we spend on all of these, except air pollution.
Money for this has to come from municipal revenue and provincial budgets. But only three provinces transferred money to municipalities in 2019: Gauteng (R 637 million), KwaZulu-Natal (R 225 million) and Western Cape (R 593 million), making up a total of R 1 415 million. Virtually all of these transfers were to the five largest metros. We do not know how much was allocated to health services from municipalities’ own revenue sources.
Let’s consider three important contributors to health: refuse removal, potable water and sanitation.
If you look at how refuse statistics in 2002 and 2019, not much has changed.
|
2002 (%) |
2019 (%) |
|
|
Removed at least once per week |
56.1 |
58.8 |
|
Removed less than once per week |
2.3 |
2.4 |
|
Communal refuse dump |
3.0 |
4.7 |
|
Own refuse dump |
32.4 |
30.4 |
|
Dump or leave refuse anywhere |
5.8 |
3.2 |
|
Other removed at least once per week |
0.4 |
0.5 |
Lack of regular removal of refuse poses a risk to health which rises with population density. So it is striking to look at the following data and see that while refuse removal in areas with formal housing is well above 80%, it’s very low in informal settlements and rural areas.
|
Metro - formal |
89.9 |
|
|
Metro - informal |
25.4 |
|
|
Urban - formal |
80.1 |
|
|
Urban - informal |
34.1 |
|
|
Traditional |
7.3 |
|
|
Rural |
11.2 |
Water is piped if it is delivered to homes, yards, neighbours’ taps or communal taps. Government’s provision of piped water improved between 2002 and 2019, from 82% to 88%. But It has not all been forward movement.
While access to piped water increased substantially in the Eastern Cape and KwaZulu-Natal over the period, the percentage of households with access decreased in five provinces: Mpumalanga, Limpopo, Free State, North West and (marginally) Western Cape. Moreover, 2.9% of all households (half a million) in 2019 reported that they once had piped water but lost it because supply systems broke down. The technical version of this article has more detail.
Interruptions to municipal water supply services are common. Households are regarded as having an unreliable municipal supply if interruptions that lasted more than two days at a time, or more than 15 days in total, occurred during the year they were surveyed. Using this measure over a quarter of households had an unreliable supply in 2018/19. Unreliability was experienced by about one-eighth of metro households, one-quarter of non-metro households, a third of rural households, and a staggering two-thirds of households in traditional areas.
As for quality of water, what is noteworthy is the large numbers of water service authorities for which no reports are available. For example over 40% have not provided microbiological reports (see the technical version of the article for details).
Improved sanitation facilities are defined as flush toilets connected to a public sewerage system or a septic tank, or a pit toilet with a ventilation pipe. Nationally, the percentage of households with access to improved sanitation increased from 61.7% in 2002 to 82.1% in 2019. Progress was made in every province in the intervening period, and was strongest in Eastern Cape, Limpopo and KwaZulu-Natal.
This table shows the percentages of households with flush toilets connected to municipal sewerage. This is the appropriate form of sanitation in densely populated areas, so it can be seen that there is a considerable distance to go in metro and urban informal areas, as well as in formal townships and dense settlements in traditional areas.
|
Metro - formal |
91.3 |
|
Metro - informal |
27.1 |
|
Urban - formal |
85.5 |
|
Urban - informal |
32.6 |
|
Traditional |
3.2 |
|
Rural |
20.0 |
|
All |
59.9 |
In May and June 2019, AfriForum tested the sewage systems of 124 towns. There were 65 Sewage Treatment Works that did not comply with South African national water quality standards, in terms of which treated sewage may not contain more than 1,000 units of E. coli per 100 ml of treated sewage. This is a highly unsatisfactory state of affairs and risks microbiological contamination of drinking water.
The poor quality of local government outside Western Cape and Gauteng has been a problem ever since the introduction of the current system twenty years ago. The problem has been getting worse in recent years (see the technical article for details). One initiative after another has failed to make a significant dent in the mess. The jury is out on the latest programme – the District Development model.
As a result, most local governments are doing less than they should to promote healthy conditions, and some are seriously deleterious to the wellbeing of their inhabitants. Turning the situation around will not be easy, especially in a period of fiscal stress.