14 November 2025
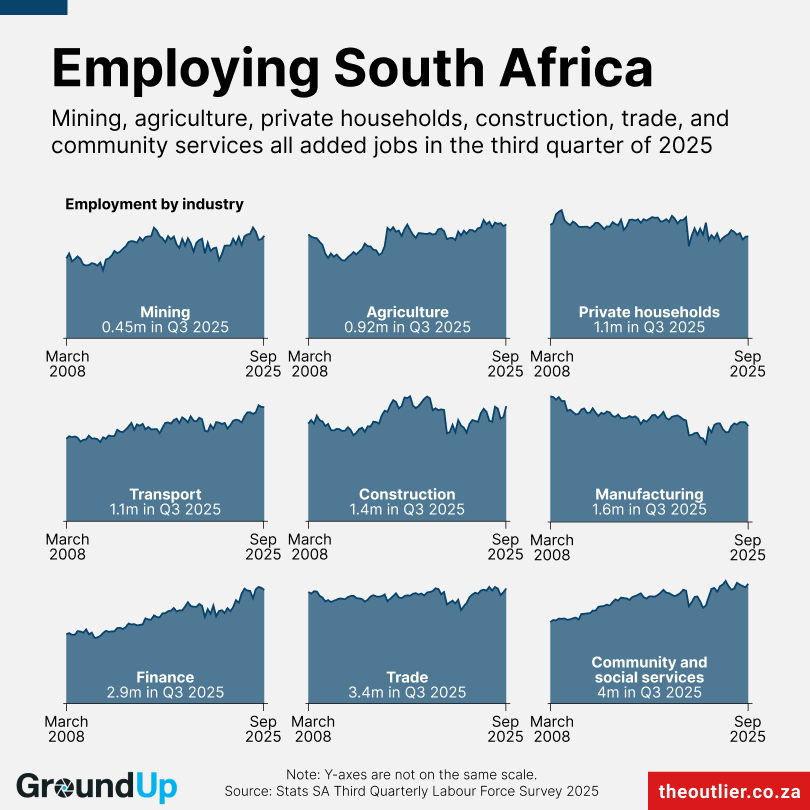
248,000 new jobs were created in the third quarter (Q3) of the year, according to the latest employment data released by StatsSA on Tuesday. Our chart this week shows how employment has changed since 2008.
The official unemployment rate at the end of Q3 is 31.9%, down from 33.2% at the end of the Q2. If people who have stopped looking for work are included (the expanded definition of unemployment), the unemployment rate is 42.4%, down from 43.0%.
But the increase in jobs is also linked to a new method StatsSA used to estimate employment in the informal sector, so it should probably be treated with caution. And taking the first two quarters of the year into account, the economy has still lost about 24,000 jobs so far this year.
StatsSA’s quarterly labour force data goes back to 2008. At the start of that year, South Africa had an unemployment rate of 23.2%, with 14.4-million people employed. At the end of the third quarter of 2025, there were 17-million people with jobs in the country. But because of population growth, the unemployment rate is still higher than in 2008, at 31.9%. The working-age population was 31.5-million in 2008 and is now approximately 41.9-million.
The number of jobs in the manufacturing industry has decreased significantly since 2008 – from 2.1-million to 1.6-million.
Private household jobs – like domestic workers, gardeners, and other paid jobs that take place within households – are also down, from 1.2-million in 2008 to 1.1-million in Q3 of this year.
But steady increases in employment, above the rate of population growth, have been seen in the finance, transport and community and social services sectors. Collectively, these sectors have added 2.7-million jobs since 2008.
While the number of jobs in other sectors has increased, it has not been enough to keep up with population growth (the labour force has grown by about 33% since 2008):
Chart produced by The Outlier in partnership with GroundUp